")
LinkedIn Analytics Dashboard: In today’s digital-first world, businesses are no longer guessing about what works and what doesn’t. Platforms like LinkedIn have become powerful engines for professional networking, B2B marketing, and thought leadership. But here’s the truth: simply posting content isn’t enough. To maximize results, brands need to measure performance, understand audience behavior, and fine-tune strategies accordingly.
That’s where the LinkedIn Analytics Dashboard comes in.
At The Info Technologies: Digital Marketing Agency, we help brands leverage LinkedIn’s analytics dashboard to unlock actionable insights, boost engagement, and ultimately convert connections into leads. In this blog, we’ll take a deep dive into what the LinkedIn analytics dashboard is, how to use it effectively, and why it’s an indispensable tool for your digital marketing strategy.
What Is the LinkedIn Analytics Dashboard?
The LinkedIn analytics dashboard is a built-in reporting tool that provides key insights into how your content, company page, and campaigns perform. Think of it as a control panel where you can monitor audience demographics, engagement trends, follower growth, and post effectiveness.
For businesses and professionals, this dashboard serves as a real-time guide to:
-
Identify which content resonates with your audience.
-
Track how your follower base is growing.
-
Understand who is engaging with your content (job roles, industries, locations).
-
Optimize LinkedIn campaigns for better ROI.
Without it, businesses are essentially flying blind.
Why the LinkedIn Analytics Dashboard Matters for Businesses
Whether you’re a startup founder, B2B marketer, or established enterprise, the dashboard is more than just numbers. It provides a strategic roadmap. Here’s why it matters:
-
Data-Driven Decisions
No more “posting and hoping.” Analytics empower you to understand what content works best, allowing for smarter strategies. -
Audience Insights
You can discover exactly who your audience is—job function, company size, seniority level—and align your messaging accordingly. -
Performance Tracking
From impressions to clicks, the dashboard breaks down how your posts perform, helping you double down on successful formats. -
Competitive Advantage
Monitoring your metrics ensures you’re not falling behind competitors who may already be using these insights. -
Lead Generation
More importantly, the LinkedIn analytics dashboard is a tool for spotting potential leads. Engagement data can reveal warm prospects you can nurture further.
Key Metrics in the LinkedIn Analytics Dashboard
To fully utilize LinkedIn analytics, it’s crucial to understand the core metrics provided in the dashboard:
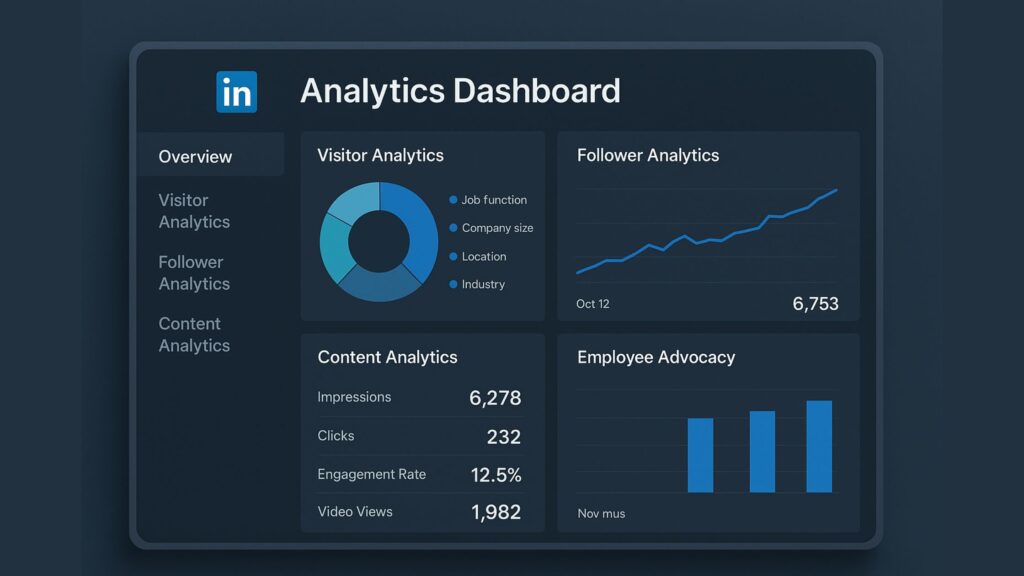
1. Visitor Analytics
This section gives insights into who’s visiting your page. You can filter by:
-
Job function
-
Company size
-
Location
-
Industry
This helps you understand if your content is attracting the right audience.
2. Follower Analytics
Follower data allows you to track:
-
Total number of followers
-
Follower growth trends over time
-
Demographic breakdowns (seniority, industry, location)
This shows whether your brand is expanding in the right markets.
3. Content Analytics
This is where engagement comes alive. Metrics include:
-
Impressions: How many times your content was viewed.
-
Clicks: How many people clicked on your content or links.
-
Engagement Rate: Interactions (likes, shares, comments) compared to impressions.
-
Video Views: For multimedia posts.
These insights highlight what kind of content—text posts, carousels, videos—resonates most.
4. Employee Advocacy Analytics
If your employees engage with or share your company’s posts, LinkedIn provides data on how that impacts reach and engagement.
5. Competitor Analytics (New)
LinkedIn also provides comparative metrics, helping you benchmark your performance against competitors.
How to Use the LinkedIn Analytics Dashboard to Your Advantage
Here’s how businesses can unlock growth through LinkedIn analytics:
1. Identify Top-Performing Content
Use content analytics to see which posts generate the most engagement. Double down on similar content styles, formats, or topics.
2. Optimize Posting Times
Analytics can reveal when your audience is most active. Align your posting schedule to maximize visibility.
3. Tailor Messaging by Audience Demographics
If your dashboard shows most of your followers are decision-makers in IT, your content should address industry challenges, trends, and solutions in tech.
4. Measure Campaign ROI
For paid LinkedIn campaigns, the dashboard helps measure cost-per-click (CPC), impressions, and conversions—ensuring you know exactly what’s working.
5. Track Employee Engagement
Encourage employees to share company content. Then measure how that amplifies reach and engagement.
6. Benchmark Against Competitors
By monitoring competitor metrics, you can set realistic goals and outperform industry rivals.
Common Mistakes Businesses Make with LinkedIn Analytics
Even with a powerful tool like the LinkedIn analytics dashboard, many businesses fail to fully capitalize on it. Some common mistakes include:
-
Focusing only on vanity metrics (likes instead of conversions).
-
Ignoring demographic data when crafting content.
-
Not experimenting with different content formats.
-
Failing to adjust strategies based on analytics.
At The Info Technologies, we help brands avoid these pitfalls and turn raw data into actionable strategies.
Best Practices for Maximizing LinkedIn Analytics
To ensure your analytics strategy yields results, here are some best practices:
-
Set Clear Goals: Are you aiming for brand awareness, lead generation, or thought leadership?
-
Track Consistently: Review analytics weekly or monthly to spot trends.
-
Experiment with Content: Test videos, polls, carousels, and articles.
-
Engage with Insights: If analytics show strong engagement from a specific industry, create industry-tailored campaigns.
-
Collaborate with Experts: Partner with agencies like The Info Technologies for expert data interpretation and execution.
Case Study: LinkedIn Analytics in Action
One of our clients—a B2B SaaS provider—struggled to generate leads from LinkedIn. By leveraging the LinkedIn analytics dashboard, we discovered:
-
Their audience engaged most with video explainers.
-
Engagement rates were higher mid-week mornings.
-
Competitors were gaining traction with carousel ads.
With this data, we shifted their strategy:
-
Focused on video-first content.
-
Scheduled posts on Wednesdays and Thursdays.
-
Launched targeted carousel campaigns.
The result? A 75% increase in engagement and a 40% boost in qualified leads in just three months.
The Future of LinkedIn Analytics
LinkedIn continues to upgrade its analytics dashboard with features like competitor tracking, advanced campaign insights, and integration with third-party tools. Businesses that embrace these advancements will have a clear edge in building relationships and driving growth.
Conclusion: LinkedIn Analytics Dashboard
In the digital age, marketing without analytics is like sailing without a compass. The LinkedIn analytics dashboard isn’t just a reporting tool—it’s a growth engine. When used effectively, it helps businesses build brand authority, attract high-quality leads, and stay ahead of competitors.
At The Info Technologies: Digital Marketing Agency, we specialize in helping businesses unlock the full potential of LinkedIn. From analytics interpretation to crafting data-driven campaigns, we ensure your brand thrives in the competitive digital space.
Ready to Supercharge Your LinkedIn Strategy?
Don’t just post—analyze, optimize, and grow with expert guidance.
Get in touch with us today at theinfotechnologies@gmail.com and let’s turn your LinkedIn presence into a powerful lead-generation engine.
Related Articles
- LinkedIn Update to Terms: What It Means for You and How to Manage Your Data
- How to Use LinkedIn Sales Navigator: A Complete Guide to Smarter B2B Prospecting
- LinkedIn Text Formatter – Boost Engagement & Leads | The Info Technologies
- LinkedIn Post Formatter: How to Create Impactful Content That Drives Engagement
- Account Based Marketing on LinkedIn: The Info Technologies – Digital Marketing Agency
- Affiliate Marketing on LinkedIn: Unlocking Professional Networks for Maximum ROI
- LinkedIn Post Ideas to Boost Engagement and Generate Leads
- LinkedIn Profile URL: How to Customize, Optimize, and Share It for Professional Growth
- LinkedIn Profile Optimization Tips: Boost Your Visibility & Attract More Opportunities
- LinkedIn Newsletter: Drive Traffic & Leads Through LinkedIn